Advanced Certificate in Data Visualization for Financial Insights with R
Flexible Learning
24/7 Support
Enrol & Start Anytime
Recommended Learning Hours : 2-4 Hrs/Week
Course Fee
£49
Or Equivalent Local Currency
Advanced Certificate in Data Visualization for Financial Insights with R
£49
• 2 MonthsAssessment Type
Quiz Based
Non Credit Bearing
Qualification
Duration
2 Months
Pedagogy
Online
Learning Style
Self Paced
Course Overview
Course Overview
This course is designed for finance professionals and data analysts seeking to enhance their data visualization skills using R. Key beneficiaries include financial analysts, portfolio managers, risk managers, and business analysts. They will learn to create interactive and dynamic visualizations, empowering them to extract actionable insights from financial data.
Upon completion, participants will gain hands-on experience in using R for data visualization, including data manipulation, visualization best practices, and storytelling techniques. They will be able to communicate complex financial data insights effectively, driving informed decision-making and business growth.
Description
Unlock the Power of Data Visualization for Financial Insights
Take the next step in your data analysis journey with our Advanced Certificate in Data Visualization for Financial Insights with R. This comprehensive course will equip you with the skills to extract actionable insights from complex financial data and present them in a clear, compelling manner.
By mastering data visualization with R, you'll be able to drive business decisions, identify trends, and optimize financial performance. Our expert instructors will guide you through hands-on projects, real-world examples, and interactive sessions.
Unlock new career opportunities as a data analyst, financial analyst, or business intelligence specialist. Stand out in a competitive job market with a unique combination of technical and business skills. Join our community of data enthusiasts today and start telling powerful stories with data.
Key Features
Quality Content
Our curriculum is developed in collaboration with industry leaders to ensure you gain practical, job-ready skills that are valued by employers worldwide.
Created by Expert Faculty
Our courses are designed and delivered by experienced faculty with real-world expertise, ensuring you receive the highest quality education and mentorship.
Flexible Learning
Enjoy the freedom to learn at your own pace, from anywhere in the world, with our flexible online learning platform designed for busy professionals.
Expert Support
Benefit from personalized support and guidance from our expert team, including academic assistance and career counseling to help you succeed.
Latest Curriculum
Stay ahead with a curriculum that is constantly updated to reflect the latest trends, technologies, and best practices in your field.
Career Advancement
Unlock new career opportunities and accelerate your professional growth with a qualification that is recognized and respected by employers globally.
Topics Covered
- Introduction to Data Visualization: Understanding the fundamentals of data visualization and its importance in finance.
- Data Preprocessing and Cleaning: Preparing and cleaning financial data for visualization using R.
- Exploratory Data Analysis with R: Using R for exploratory data analysis to gain insights into financial data.
- Visualization Best Practices: Learning visualization best practices for effective financial data storytelling.
- Advanced Visualization Techniques: Applying advanced visualization techniques using R for financial insights.
- Communicating Financial Insights: Effectively communicating financial insights through data visualization and storytelling.
Key Facts
Overview
Boost your skills in data visualization for financial insights with R.
Key Details
Audience: Finance professionals seeking data visualization skills.
Prerequisites: Basic R programming knowledge, finance background.
Outcomes:
Develop financial data visualization skills with R.
Create interactive dashboards for financial insights.
Analyze financial data with advanced R techniques.
Why This Course
Learners seeking to gain expertise in data visualization for financial insights should consider the Advanced Certificate in Data Visualization for Financial Insights with R.
Here are three key benefits:
Develop in-demand skills, including data visualization and R programming.
Enhance their ability to analyze and interpret complex financial data.
Boost their career prospects in finance, business, and related fields.
By choosing this course, learners can gain a competitive edge in the job market and advance their careers.
Course Podcast
Listen to industry experts discuss key concepts and real-world applications of this course.
Course Brochure
Download the detailed course brochure to learn more about Advanced Certificate in Data Visualization for Financial Insights with R

Pay as an Employer
Request an invoice for your company to pay for this course. Perfect for corporate training and professional development.
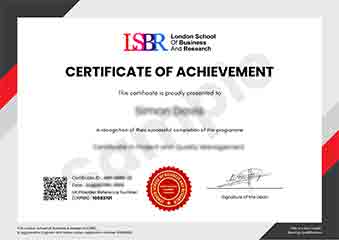
Sample Certificate
Preview the certificate you'll receive upon successful completion of this program.
Flexible Learning
24/7 Support
Enrol & Start Anytime
Recommended Learning Hours : 2-4 Hrs/Week
100% Online
Corporate Invoicing Available
What People Say About Us
Hear from our students about their experience with the Advanced Certificate in Data Visualization for Financial Insights with R at FlexiCourses.
Charlotte Williams
United Kingdom"This course provided a comprehensive and well-structured curriculum that effectively bridged the gap between data visualization concepts and practical implementation in R, allowing me to develop a strong foundation in creating insightful and engaging financial visualizations. The course content and hands-on exercises enabled me to gain practical skills in data manipulation, visualization, and communication, which I believe will significantly enhance my career prospects in data analysis and business intelligence. Overall, the course has been instrumental in equipping me with the skills and knowledge necessary to effectively communicate complex financial data insights."
Siti Abdullah
Malaysia"This course has been instrumental in upgrading my data analysis skills, enabling me to effectively communicate complex financial insights through interactive and informative visualizations that resonate with stakeholders in the industry. The knowledge and skills gained have significantly enhanced my ability to drive business decisions with data-driven recommendations, leading to a notable career advancement in my current role. The course's emphasis on practical applications has been invaluable in helping me stay ahead in the competitive field of financial analysis."
Klaus Mueller
Germany"The course structure effectively balanced theoretical foundations with practical applications, allowing me to develop a comprehensive understanding of data visualization techniques in R that can be directly applied to financial analysis. The in-depth coverage of topics such as data manipulation and visualization tools significantly enhanced my ability to extract meaningful insights from complex financial data. Overall, the course provided a solid foundation for professional growth in the field of financial data analysis."
More Courses You Might Like
Explore similar courses to expand your learning journey
From Our Blog
Insights and stories from our business analytics community
Data Visualization for Financial Insights with R Customer Experience
Unlock actionable financial insights with R data visualization skills and drive business decisions with data-driven expertise.
Revolutionizing Financial Insights: How the Advanced Certificate in Data Visualization with R is Shaping the Future
Discover how the Advanced Certificate in Data Visualization with R is revolutionizing financial insights through interactive visualizations, machine learning, and alternative data sources.
Unlocking Financial Insights with R: A Deep Dive into the Advanced Certificate in Data Visualization
Unlock financial insights with the Advanced Certificate in Data Visualization for Financial Insights with R and discover how to harness data visualization to drive business growth and informed decision-making.